PyTorch Image Classification Model
A computer vision project that uses a convolutional neural network to classify CIFAR-10 images into 10 categories.
The finished model reached solid baseline performance on the CIFAR-10 test set.
A classic computer vision dataset with 10 everyday object categories.
Built with a convolutional neural network for multi-class image classification.
From 32 by 32 images to a finished classifier
I built a CNN in PyTorch to classify CIFAR-10 images into 10 categories. The project covers the full workflow from preprocessing and training to evaluation visuals that make the model's strengths and mistakes easy to see.
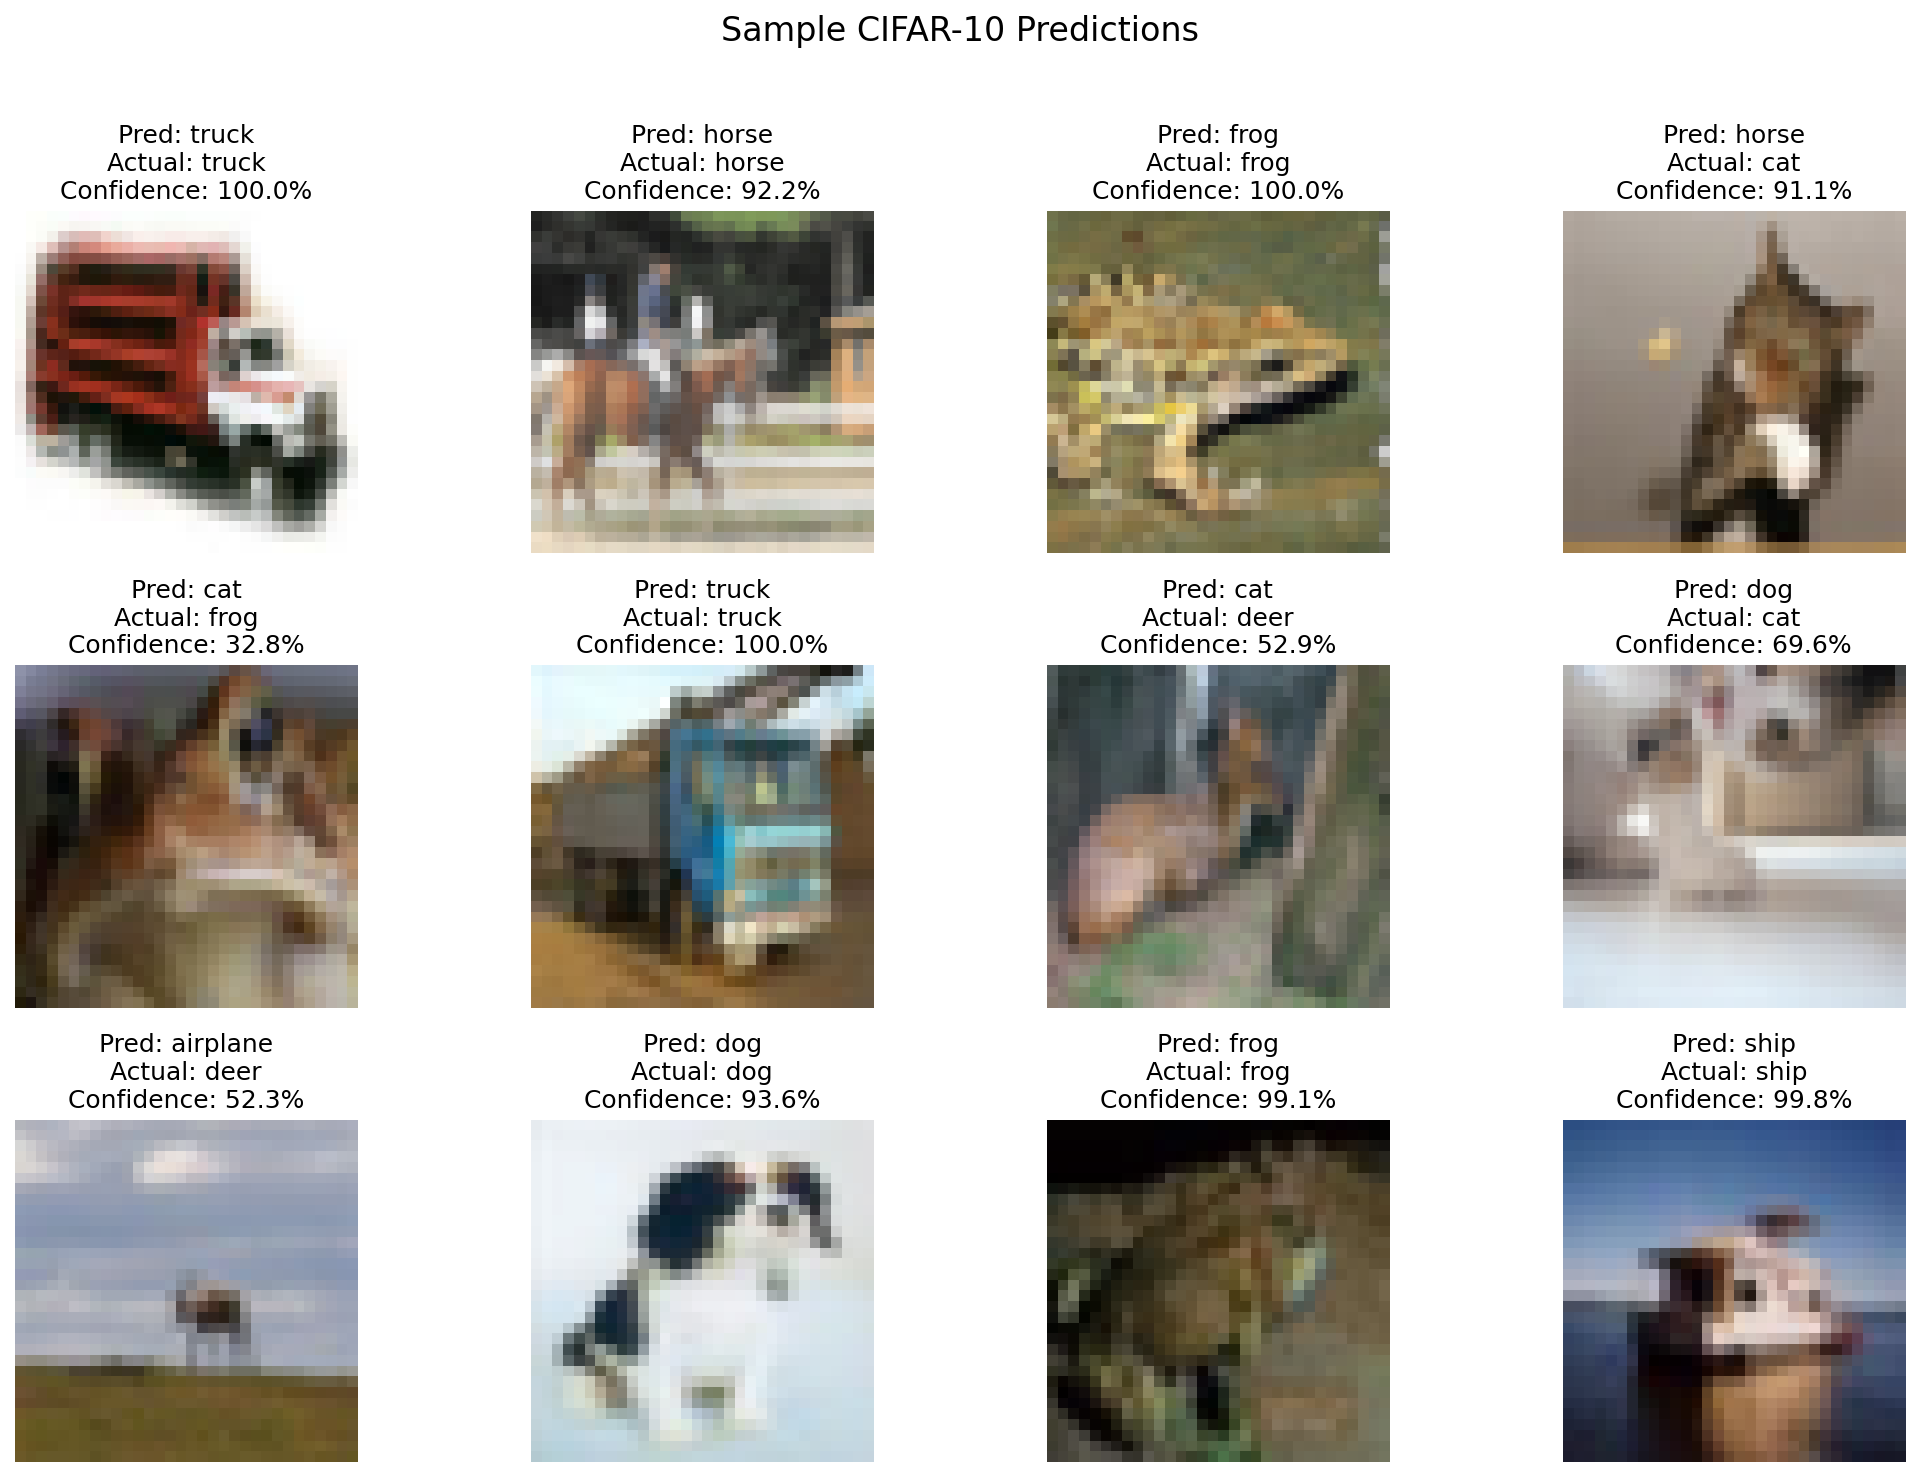
This project uses PyTorch to train a convolutional neural network on the CIFAR-10 image dataset. The model classifies small images into 10 categories, including airplanes, cars, birds, cats, dogs, ships, and trucks. The goal was to practice the full machine learning workflow: loading image data, preprocessing it, training a model, evaluating accuracy, and reviewing model mistakes with visual outputs. Categories include everyday objects like airplanes, cars, ships, and trucks alongside animals like birds, cats, dogs, and horses.
A compact CNN built for CIFAR-10
I used three convolutional blocks with ReLU activations and max pooling to learn image features in stages, then passed those features into fully connected layers for the final 10-class prediction.
Simple baseline decisions on purpose
I trained the model for 10 epochs using CrossEntropyLoss and the Adam optimizer with a learning rate of 0.001. Images were converted to tensors, normalized, and loaded in batches of 64 so I could focus on the core pipeline before trying more aggressive tuning.
What 76.20% looked like in practice
This result told me the model was learning useful visual patterns, not just guessing. It handled clearer categories like ships, trucks, automobiles, airplanes, frogs, and horses pretty well, but the confusion matrix showed a predictable weakness with similar animal classes where the visual differences are smaller and messier.
That made the evaluation more useful than the score alone. The accuracy chart showed the model improving over the 10 training epochs, while the confusion matrix made it obvious where the model still mixed up cats, dogs, deer, and birds.
Sample predictions from the trained model. This is the clearest snapshot of what I built: a model that takes a small image, predicts a class, and reports how confident it is on unseen test examples.
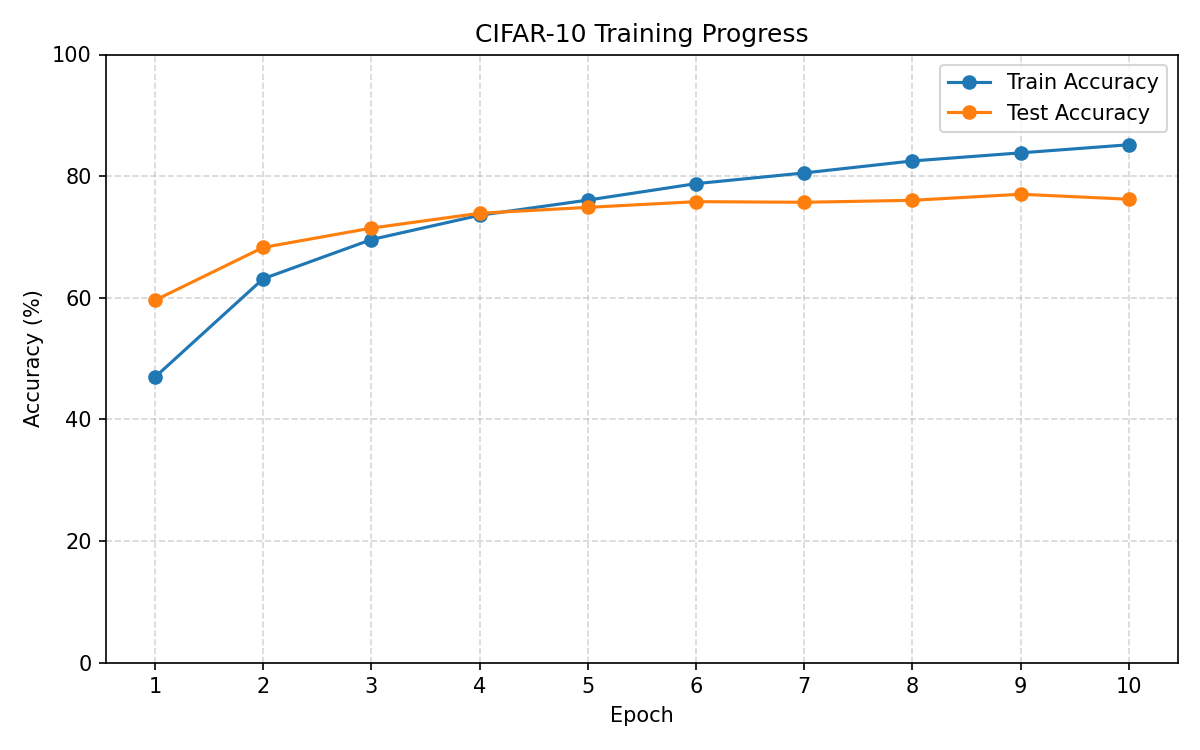
Training and test accuracy over 10 epochs. The final test score landed at 76.20%, which made this a solid baseline and gave me a clean way to compare future model changes.
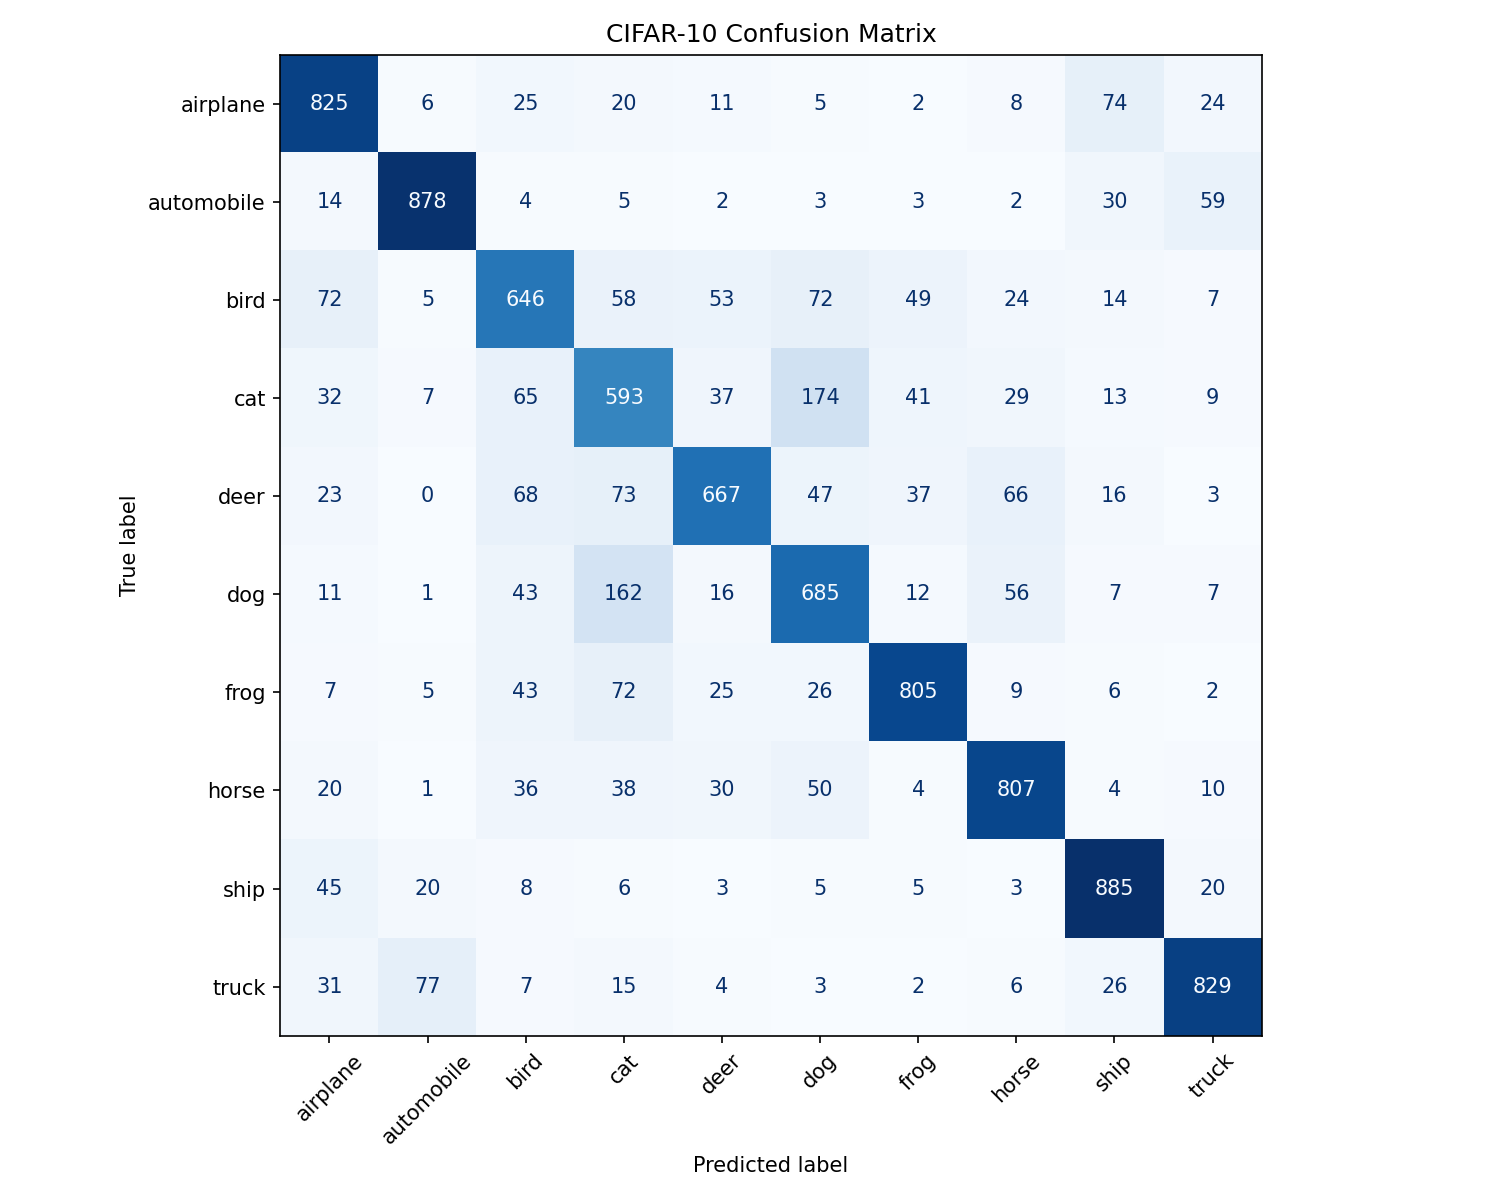
The confusion matrix shows which classes the model predicted correctly and which classes it confused. The model performed well on visually distinct categories like ships, automobiles, trucks, airplanes, frogs, and horses, while struggling more with similar animal classes like cats, dogs, deer, and birds. That pattern made the errors feel understandable instead of random.
The model learned the broad shapes faster than the fine-grained differences
The best classes were the ones with stronger visual identity, like ships, trucks, airplanes, and frogs. The harder classes were the ones that can look alike at small image size, especially cats, dogs, deer, and birds.
The confusion matrix told a better story than the score alone
The final accuracy was useful, but the confusion matrix explained where the model was actually getting tripped up. That made it easier to talk about strengths, weaknesses, and what I would change next.
I would push past 76.20% with more tuning and regularization
If I kept iterating, I would try data augmentation, longer training, learning-rate tuning, and a slightly stronger architecture. I would also pay special attention to the animal-class mix-ups instead of just chasing a single higher accuracy number.